Eco NW - State of the region
Resource flows and impacts of production and consumption in the NW
CO2 emissions
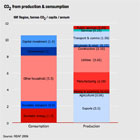
Here we can see the consumption and production CO2 side by side: in this chart, the exports and imports are both listed as production. In the conventional accounting system, exports are listed as 'consumption': while in MFA analysis imports would be counted as consumption.
Total consumer-related CO2 emissions are 11.5 t/cap which is slightly lower than the UK average of 11.8 t/cap, but higher than the 'territorial' emissions of the NW of 10.8 t/cap (i.e. emissions within the NW boundary).
Notably, domestic energy consumption in the NW is responsible for the emission of 1.7 tonnes CO2 per capita, well above the UK average of 1.5 tonnes/cap and the third highest of all UK regions. This is due to the relative inefficiency of the housing stock.