Eco NW - State of the region
Resource flows and impacts of production and consumption in the NW
3 indicators of environmental sustainability
The Eco-Region NW results draw on the REAP model / database, with 3 main indicators of environmental performance in production and consumption:
- CO2 emissions, as the largest cause of climate change
- Material flow and mass balance, which can show some of the underlying causes and effects
- Eco-footprint, as the overall measure of global impact
These are each calculated in the REAP system for the UK, and then allocated to regions by their profile of production and consumption. Where better data exists at the regional level, then it has been inserted.
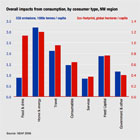
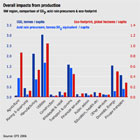
The chart shows the main differences between the eco-footprint and CO2 indicators for consumption types. The land area needed for food production increases the eco-footprint; while the fossil fuels used for heating homes increases the CO2 component.
Most of these indicators are shown as per person per year, e.g. CO2 / cap / yr. This enables easy comparison with other areas with different populations. To produce totals for the NW region, multiply the figures by 6.77 million.