Local NW - Introduction
The footprint profile of local areas and household choices
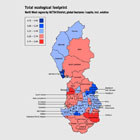
The footprint around the region
Working with the REAP toolkit this project has produced for the first time the eco-footprint and CO2 due to consumption of residents, of every local authority area in the NW.
As in other regions, there are distinct variations across the North West. The map here shows this as quite similar to the map of wealth and poverty across the region (as in the Atlas NW module).
The local areas with the largest eco-footprint (Macclesfield and Fylde) have a footprint 14% larger than the areas with the smallest (Halton and Barrow). We can see pockets in East Lancashire and a more remote area of relative poverty in the north part of Cumbria.