Production NW - Production Metabolism
The energy, materials, carbon and footprint of the NW economy
Energy in production
The first questions are on what provides the energy for business: what are the proportions of the total consumed by each sector: and what are the vulnerabilities of each sector, in the context of rising energy prices and insecurity of supply.
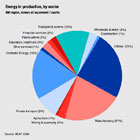
The pie chart here shows the broad distribution of primary energy around the NW economy. This shows power generation as taking the largest slice, followed by manufacturing, and by domestic energy. Commercial and public transport (including aviation) is larger than private transport, at about the same volume as the rest of the service sector.